

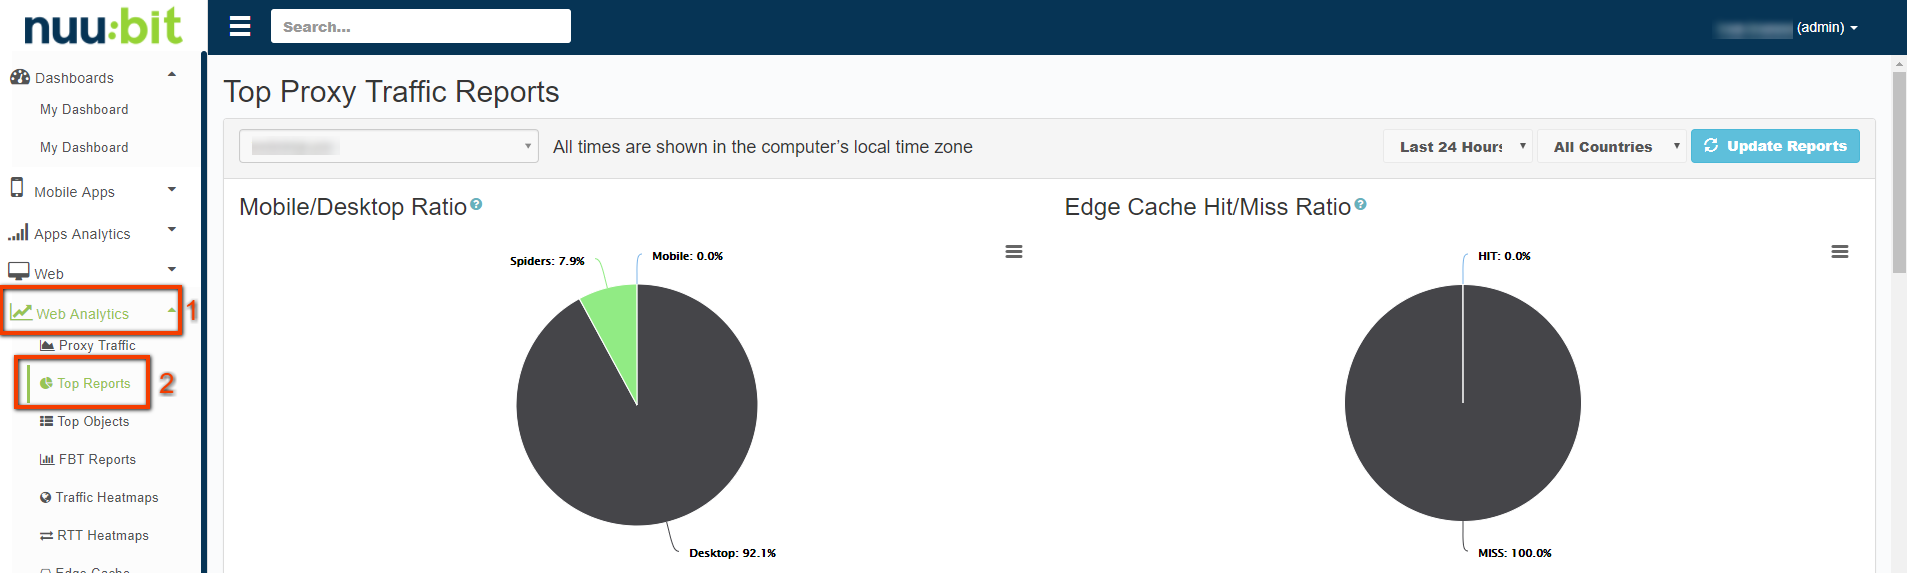
The Top Reports feature provides access to detailed proxy traffic reports. You can access the Top Reports feature by selecting Web Analytics -> Top Reports.
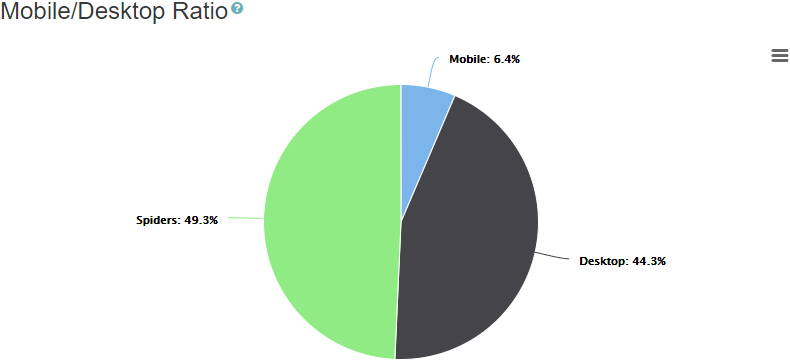
Mobile/Desktop Ratio
The Mobile/Desktop Ratio pie chart shows the distribution of traffic between desktop and mobile users, and also the amount of requests generated by web spiders (crawlers).
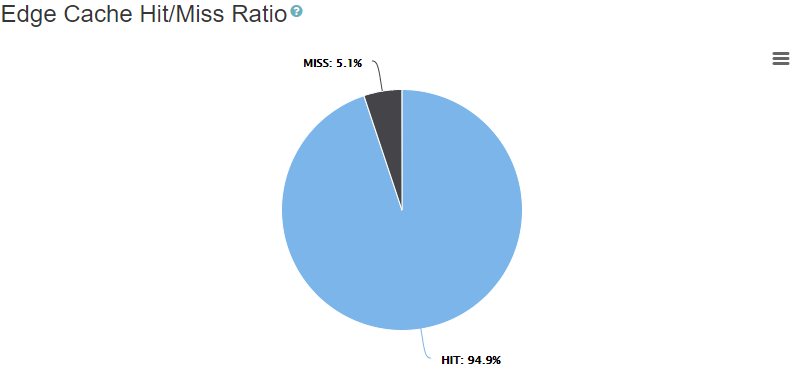
Edge Cache Hit/Miss Ratio
The Edge Cache Hit/Miss Ratio shows the ratio of cache hits (requests served directly from the cache storage on our globally distributed proxy servers) and misses (objects requested from origin servers).
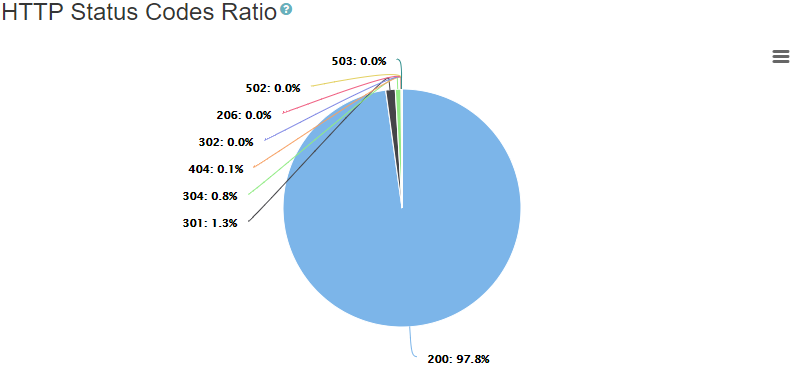
HTTP Status Codes Ratio
The HTTP Status Codes Ratio pie chart shows the ratio of different HTTP status codes for served end user requests.
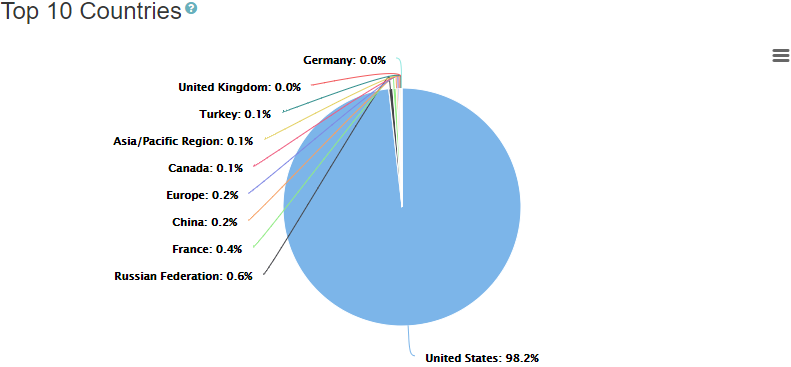
Top 10 Countries
The Top 10 Countries pie chart shows top ten countries from where end user requests were originated.
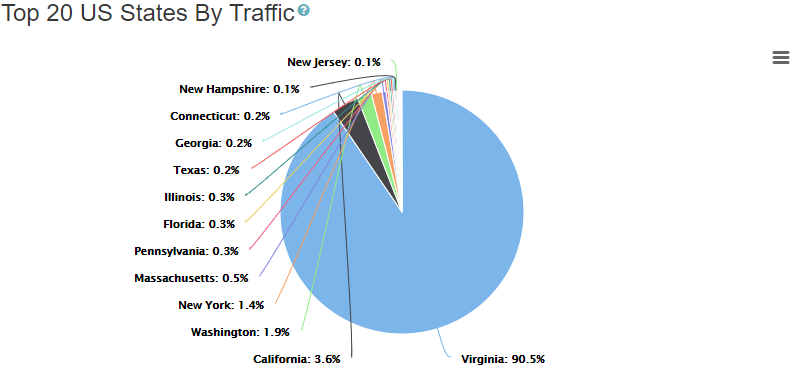
Top 20 US States By Traffic
The Top 20 US States By Traffic pie chart shows the distribution of end user traffic between US states.
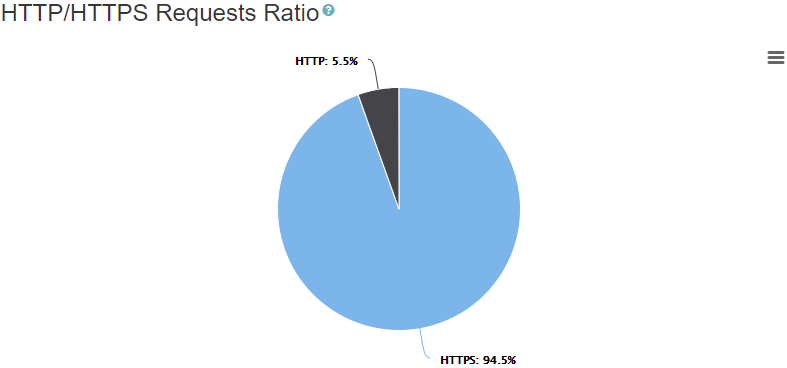
HTTP/HTTPS Requests Ratio
The HTTP/HTTPS Requests Ratio pie chart shows the ratio between HTTP and HTTPS end user requests.
HTTP Methods
The HTTP Methods pie chart shows the ratio between different HTTP methods used in end user requests.

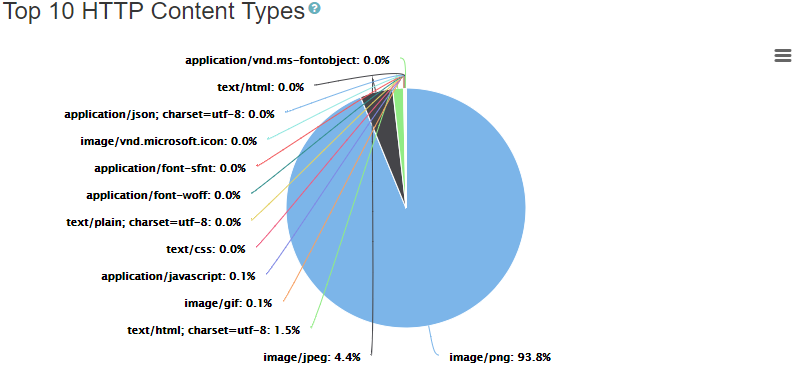
Top 10 HTTP Content Types
The Top 10 HTTP Content Types pie chart shows top 10 HTTP content types (HTTP response header "Content-Type") for served objects.
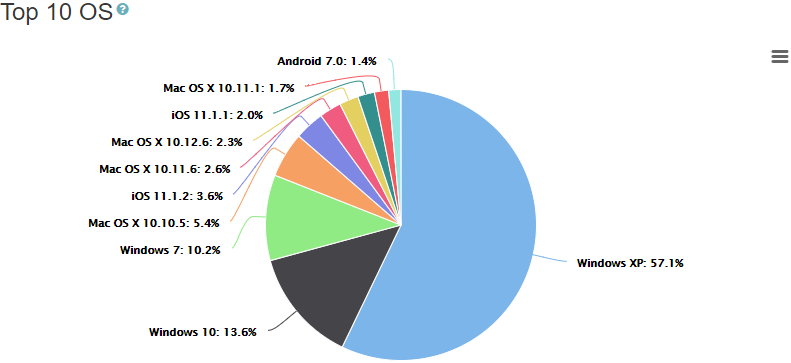
Top 10 OS
The Top 10 OS pie chart shows top 10 operating systems used by website visitors (as detected from "User-Agent" header).
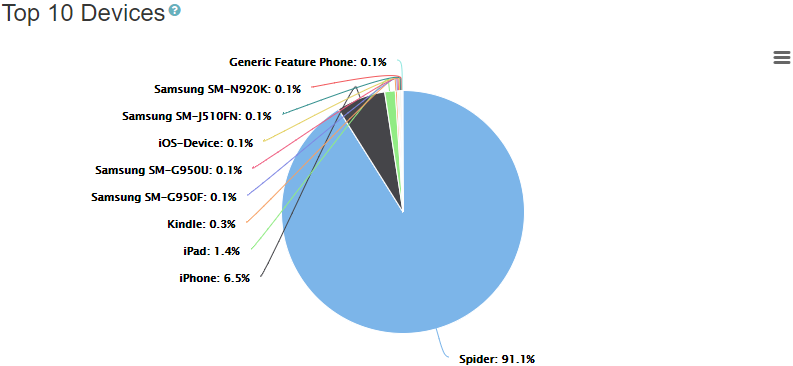
Top 10 Devices
The Top 10 Devices pie chart shows top 10 end user devices (as detected from "User-Agent" request header).
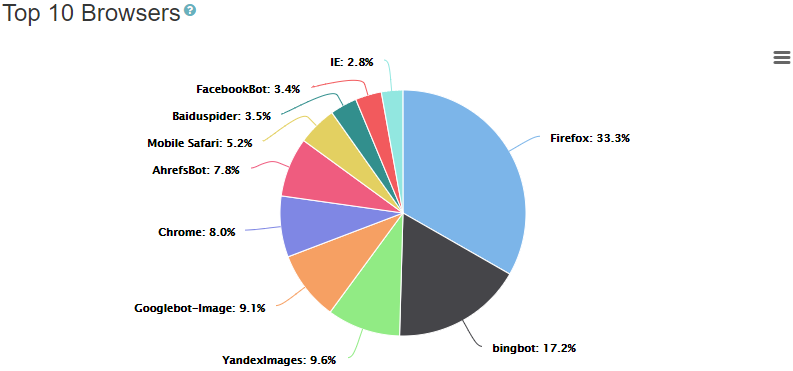
Top 10 Browsers
The Top 10 Browsers pie chart shows the Top 10 visitor browsers (as detected from "User-Agent" request header).
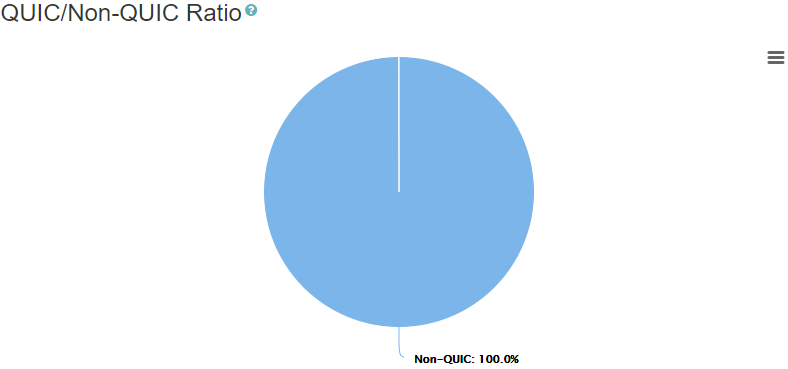
QUIC/Non-QUIC Ratio
The QUIC/Non-QUIC Ratio pie chart shows the ratio of end user requests served using modern QUIC protocol.
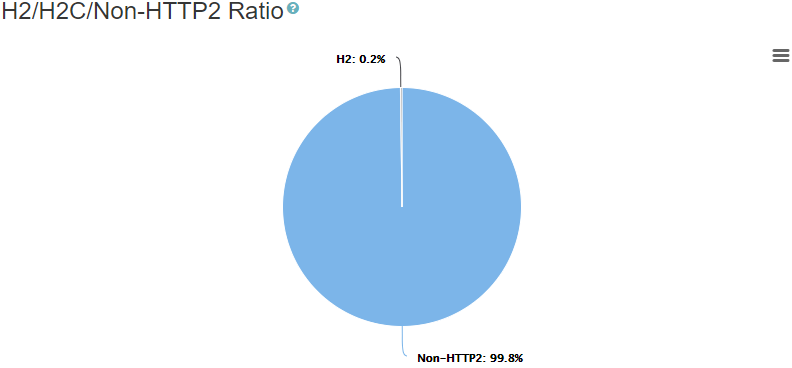
H2/H2C/Non-HTTP2 Ratio
The H2/H2C/Non-HTTP2 Ratio pie chart shows the ratio of end user requests served using HTTP2 protocol.
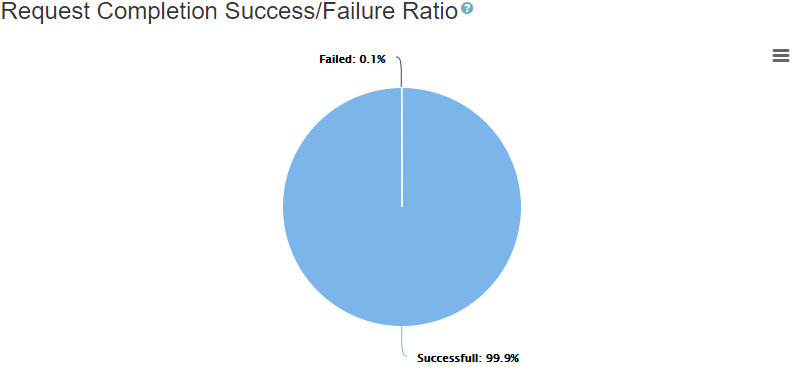
Request Completion Success/Failure Ratio
The Request Completion Success/Failure Ratio pie chart shows the ratio of requests which we believe we failed to deliver to end users. This could happen because users navigated to another page without waiting for the current page to load, last mile communication issues, data transfers cancelled by end users and several other reasons. Please note that the failures are not related to HTTP status code errors (like 5xx or 4xx) which are application-level errors and reported separately.
0 Comments