

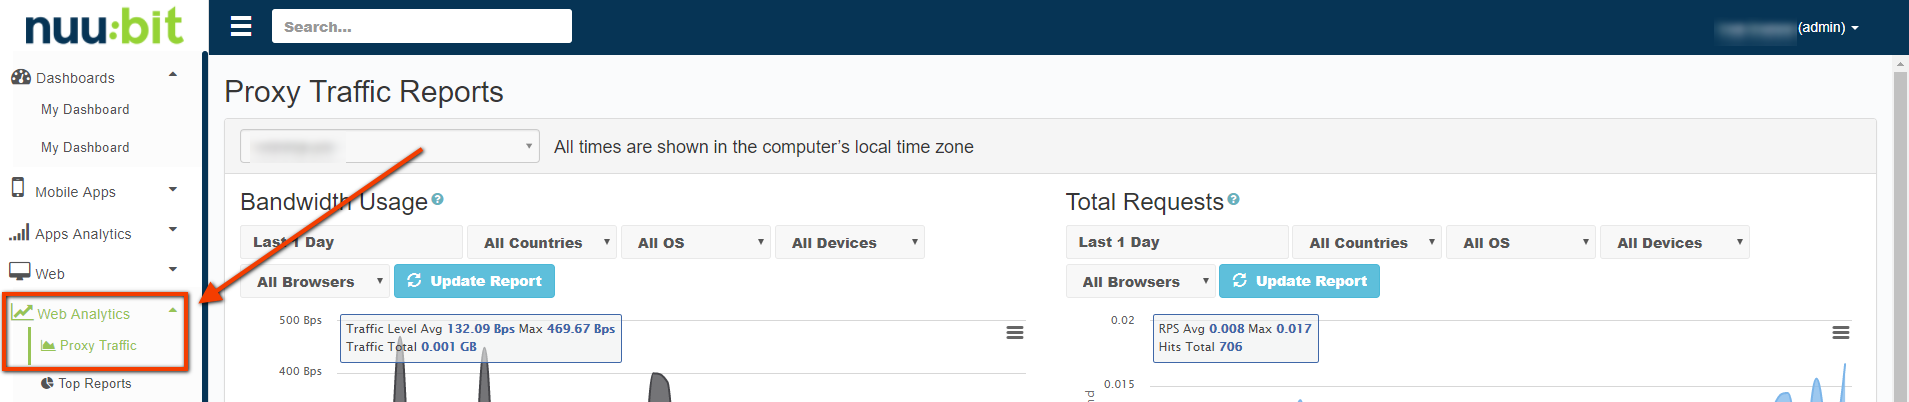
Proxy Traffic is one of the features of our Web Analytics tool. Proxy Traffic provides detailed reports about Bandwidth Usage, Total Requests, HTTP/HTTPS Hits, HTTP Status Code Hits, Success/Failure Request Status, Edge Cache Efficiency Hits, and Last Mile Round Trip Time Latency.
To access the Proxy Traffic feature, select Web Analytics -> Proxy Traffic.
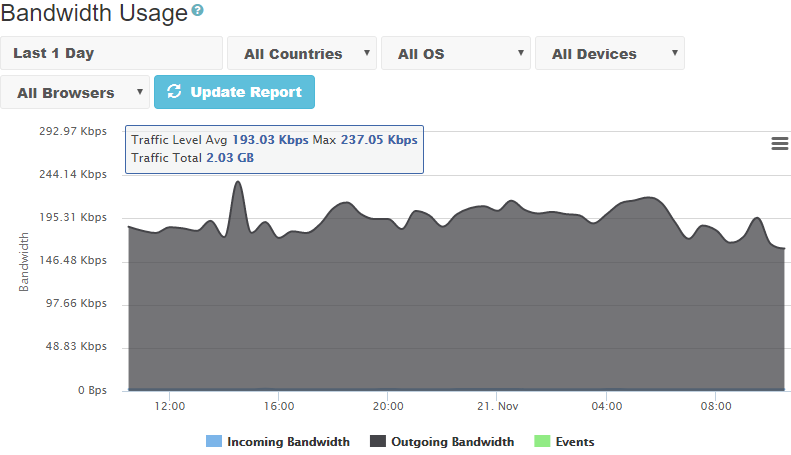
Bandwidth Usage
The Bandwidth Usage graph shows the amount of data (per second) sent ("Outgoing Bandwidth") and received ("Incoming Bandwidth") to/from website visitors.
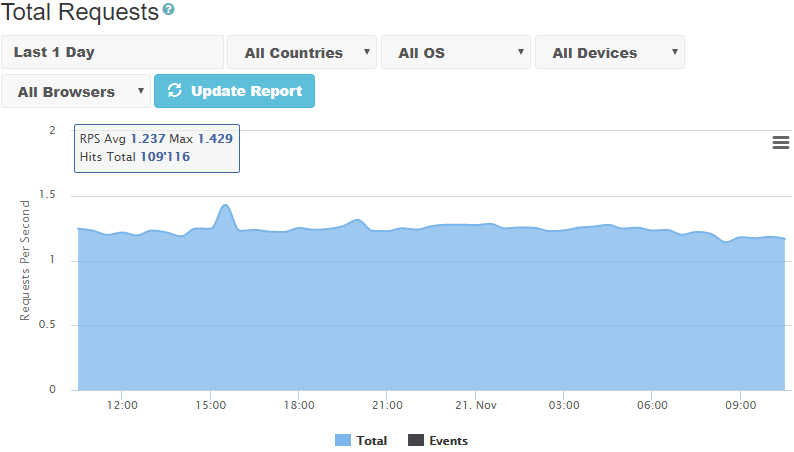
Total Requests
The Total Requests chart shows the rate (in requests per second) of all requests received for the domain.
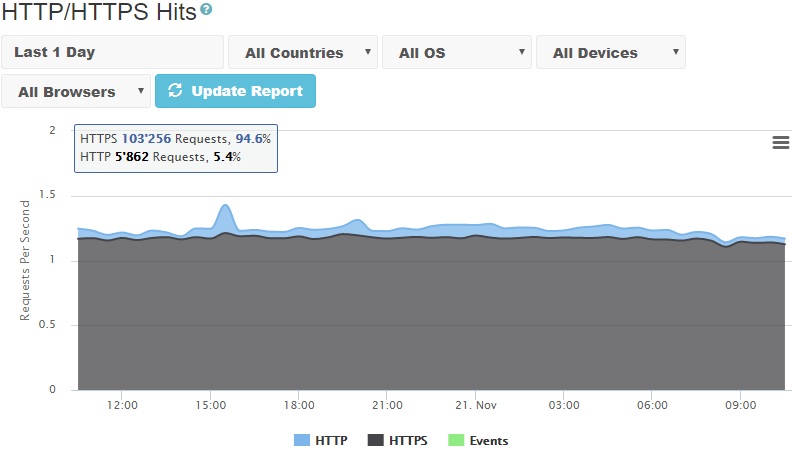
HTTP/HTTPS Hits
The HTTP/HTTPS Hits chart shows the rate of HTTP and HTTPS requests received for the reported domain.
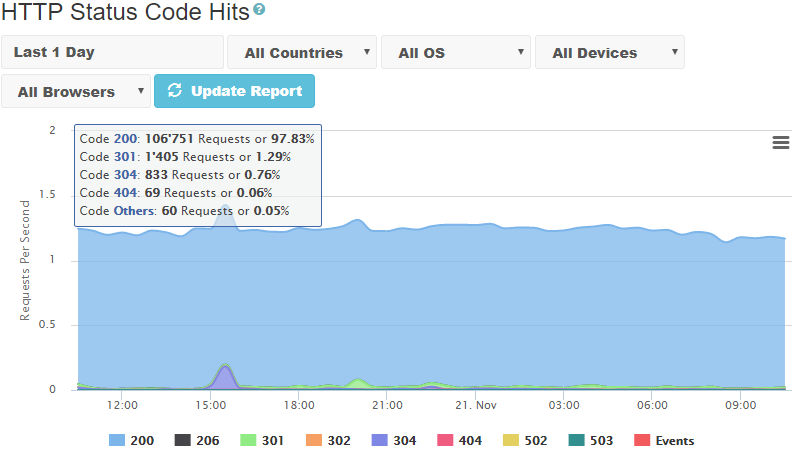
HTTP Status Code Hits
The HTTP Status Code Hits chart shows the rate of different HTTP status codes returned to visitors of the domain.
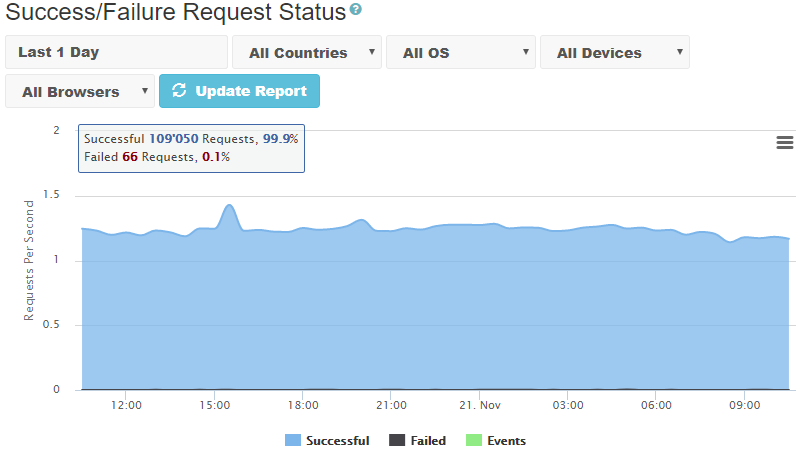
Success/Failure Request Status
The Success/Failure Request Status chart shows the rate of successfully and unsuccessfully delivered objects.
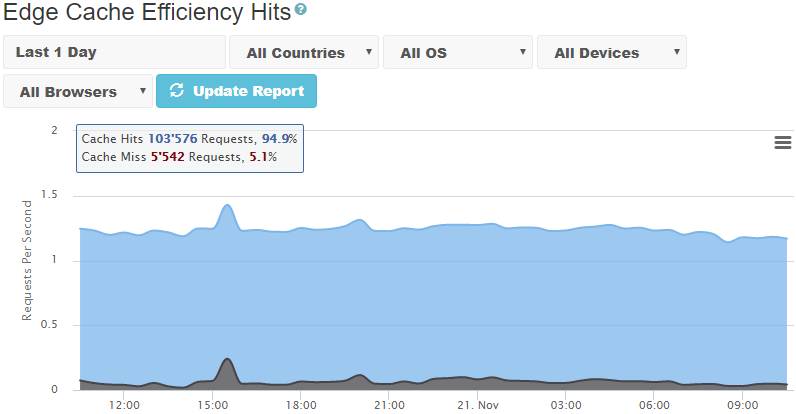
Edge Cache Efficiency Hits
The Edge Cache Efficiency Hits graph shows the rate of requests served from our edge cache storage (so-called "cache hits") and requests which required pull objects from the origin server (so-called "cache misses").
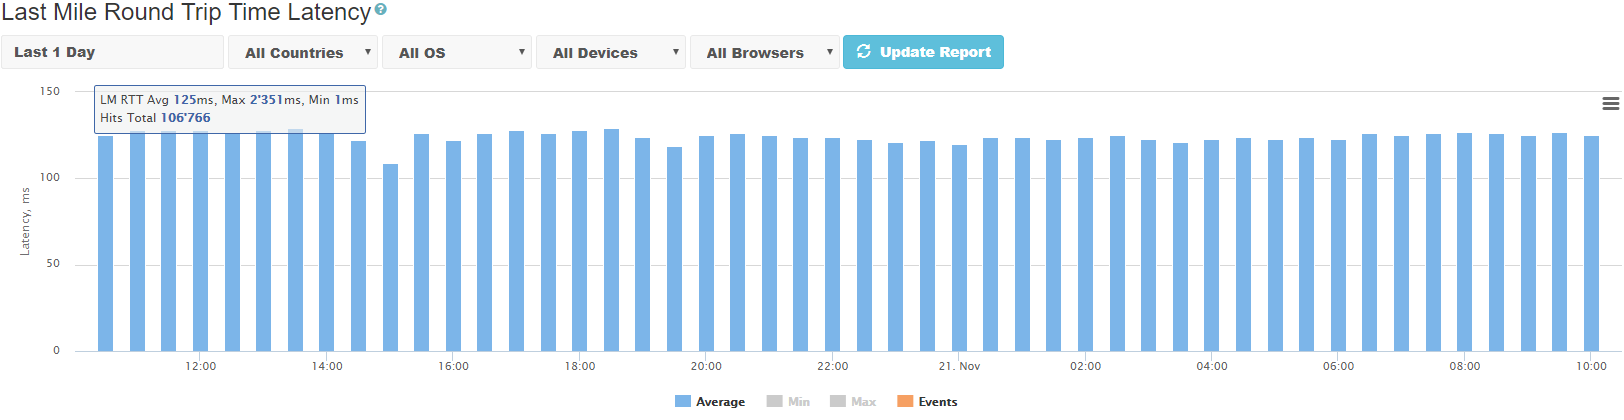
Last Mile Round Trip Time Latency
The Last Mile Round Trip Time Latency chart reports measured round-trip network latency between website visitors and our edge servers (so-called "last mile latency"). Last mile latency is normally higher for mobile users and in countries with less developed Internet infrastructure.
0 Comments