

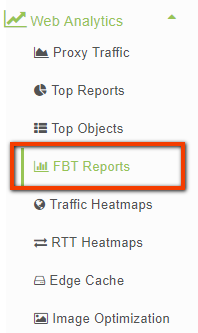
You can access the First Byte Time Reports by selecting Web Analytics -> FBT Reports.
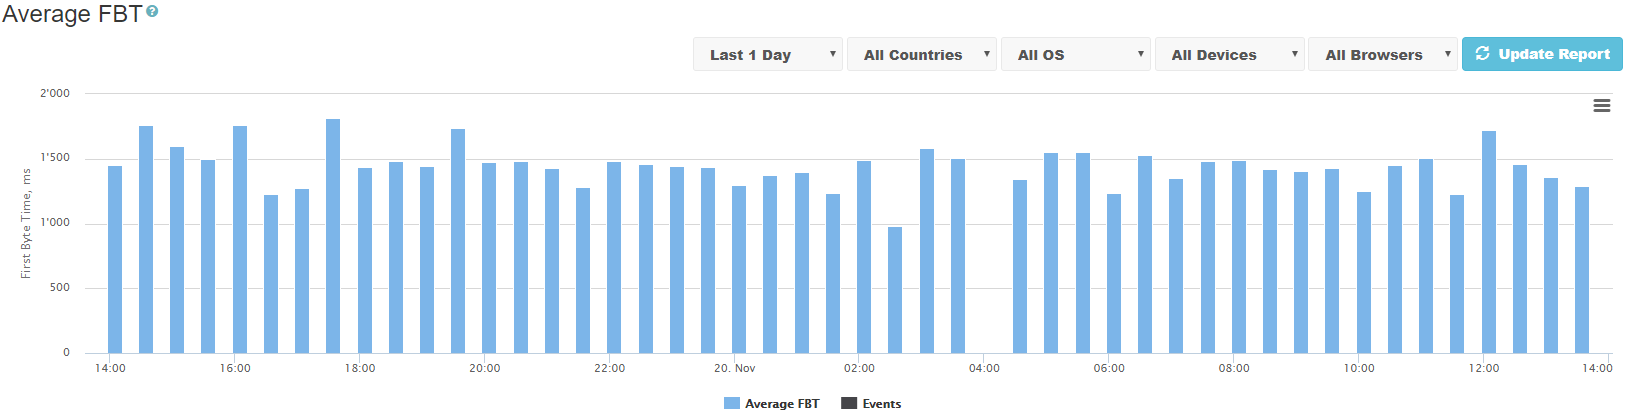
Average FBT
The Average FBT bar chart shows average First Byte Time metric for served objects as measured by the edge proxies. Lower FBT is normally associated with better end user experience.
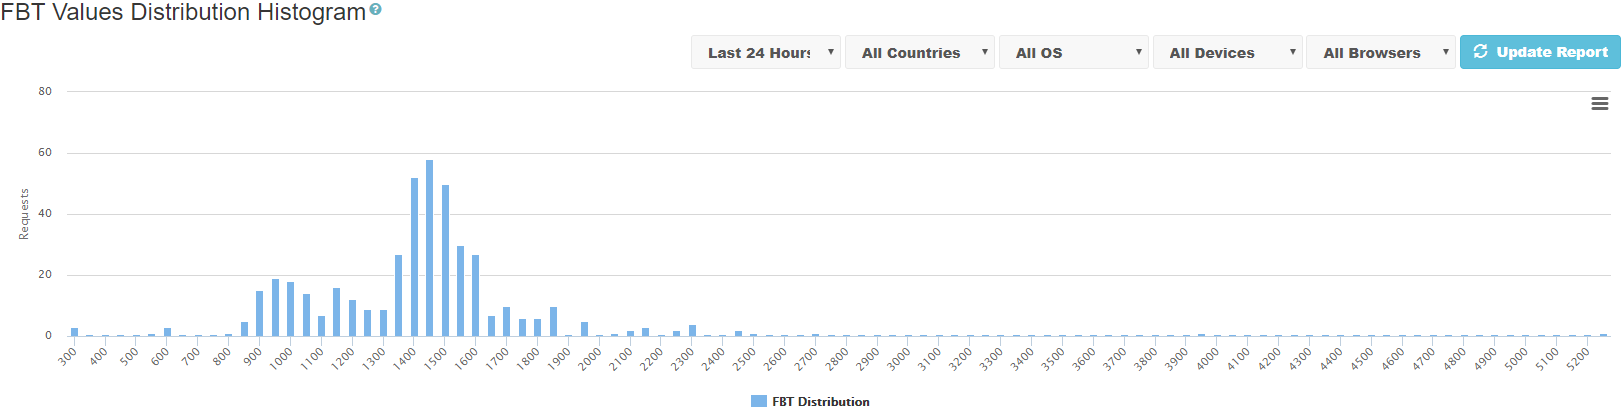
FBT Values Distribution Histogram
The FBT Values Distribution Histogram shows the distribution of First Byte Time metric. The more requests are served with lowest FBT the better is end user experience.
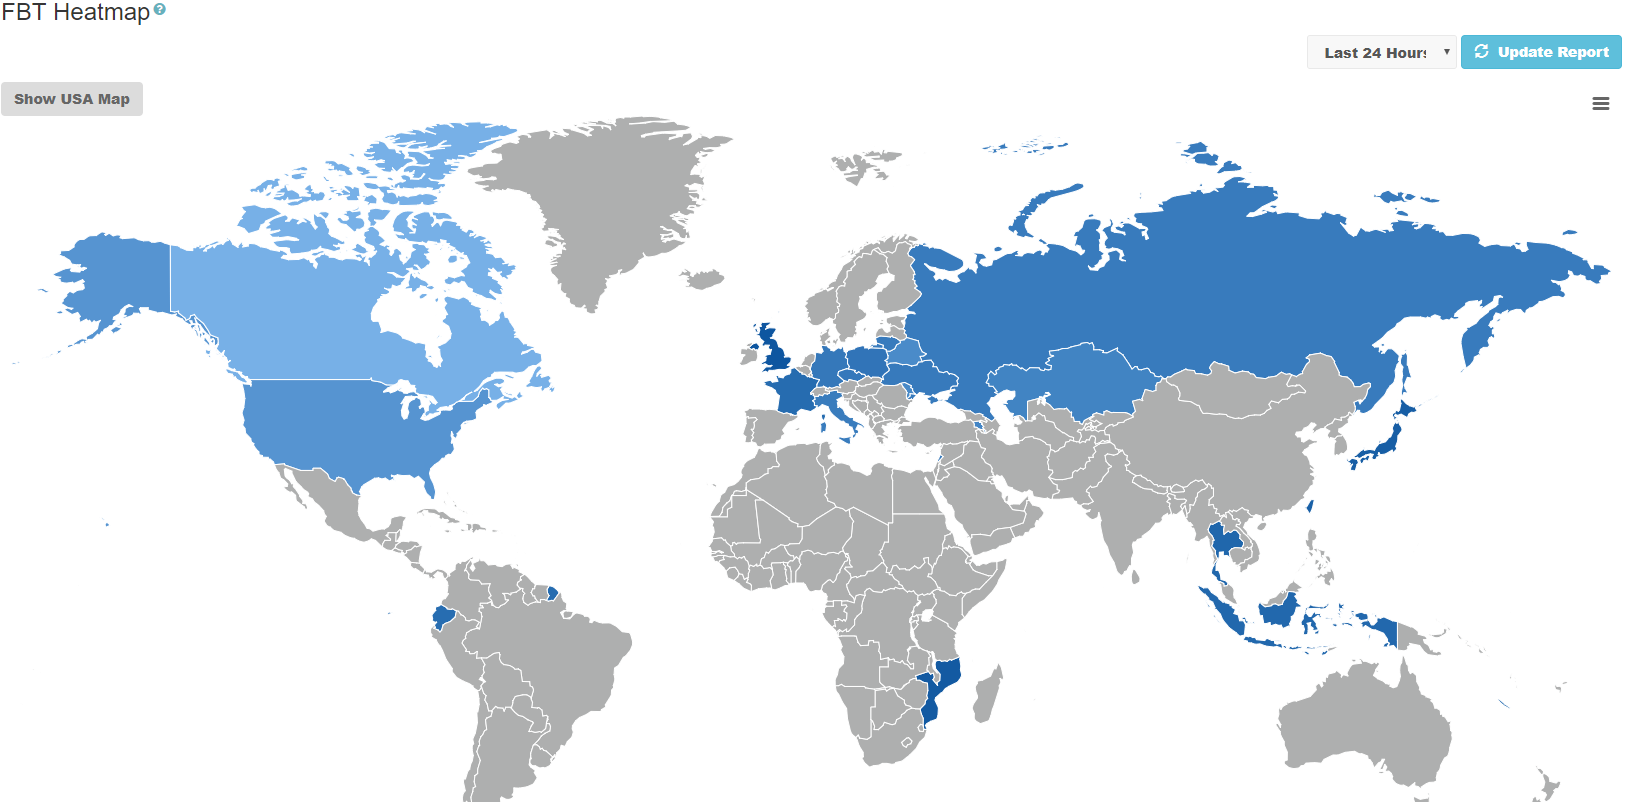
FBT Heatmap
The FBT Heatmap shows the FBT metric for different regions of the world. You can click on "Show USA Map" button to show the map of the United States.
0 Comments